


You have a number — say 1.4% — and you want to know if it’s good. Search for the average ecommerce conversion rate by industry and you’ll find a dozen tables claiming to answer that, often for the same category, often with no source attached, and often disagreeing with each other by a wide margin. That’s not because nobody has measured it. It’s because every source measures something different: a different market, a different definition of a session, a different slice of traffic. Below is what four commonly cited sources actually reported — three of them for 2026, one for 2023 — and what the gap between them tells you.
Why No Two Sources Report the Same Average Ecommerce Conversion Rate by Industry
| Source | Rate | Period | Market / base |
| IRP Commerce | 2.26% | July 2026 | Great Britain, Northern Ireland and Ireland; all sessions |
| Statista | 1.3% | Q2 2026 | Global; methodology not disclosed |
| Littledata | 1.4% | 2023 | Shopify stores only, 2,800 sites |
| Contentsquare | 0.7%–2.9% by segment | 2026 | No single average given; region unspecified |
The top two land about 1.7 times apart, and they don’t even cover the same window: one is a single month, the other a whole quarter. That’s not a rounding difference — it’s two different things being measured.
IRP Commerce publishes its figure as sessions that ended in a transaction, measured across its own panel of stores on its own platform, in Great Britain, Northern Ireland and Ireland. Both halves of that matter: the market is British and Irish, and the panel is one platform’s merchants rather than a cross-section of the web. Comparing a Canadian or US storefront to it directly isn’t a minor imprecision — those are different retail markets, with different shipping expectations, payment habits and competitors. Statista’s figure covers a quarter of the same year but doesn’t publish how sessions or purchases are counted, which means the gap between the two can’t be interpreted at all: you don’t know how much of it is the market and how much is the method.
Three more things move these numbers before anyone argues about industries. Bot filtering: unfiltered crawler traffic inflates the session count and pushes the rate down. Devices: mobile and desktop don’t convert alike, so the device mix inside a panel moves its average for reasons that have nothing to do with the stores in it. Season: a rate measured in November is not the rate measured in July. A source that doesn’t say where it stands on all three isn’t comparable to one that does.

The Typical Conversion Rate for Ecommerce That’s Three Years Out of Date
Littledata’s 1.4% is worth a closer look because it shows how a stale number survives. The figure comes from 2023, drawn from roughly 2,800 stores — and only stores running on Shopify. You will still meet it in roundups dated 2026, presented as the current benchmark, with neither the year nor the platform attached. A number that’s three retail years old, drawn from one platform’s merchants, isn’t wrong to quote — it’s wrong to quote as current. If a source doesn’t say what year its data is from, assume it isn’t this one.
One Vendor, One Year, a Fourfold Spread
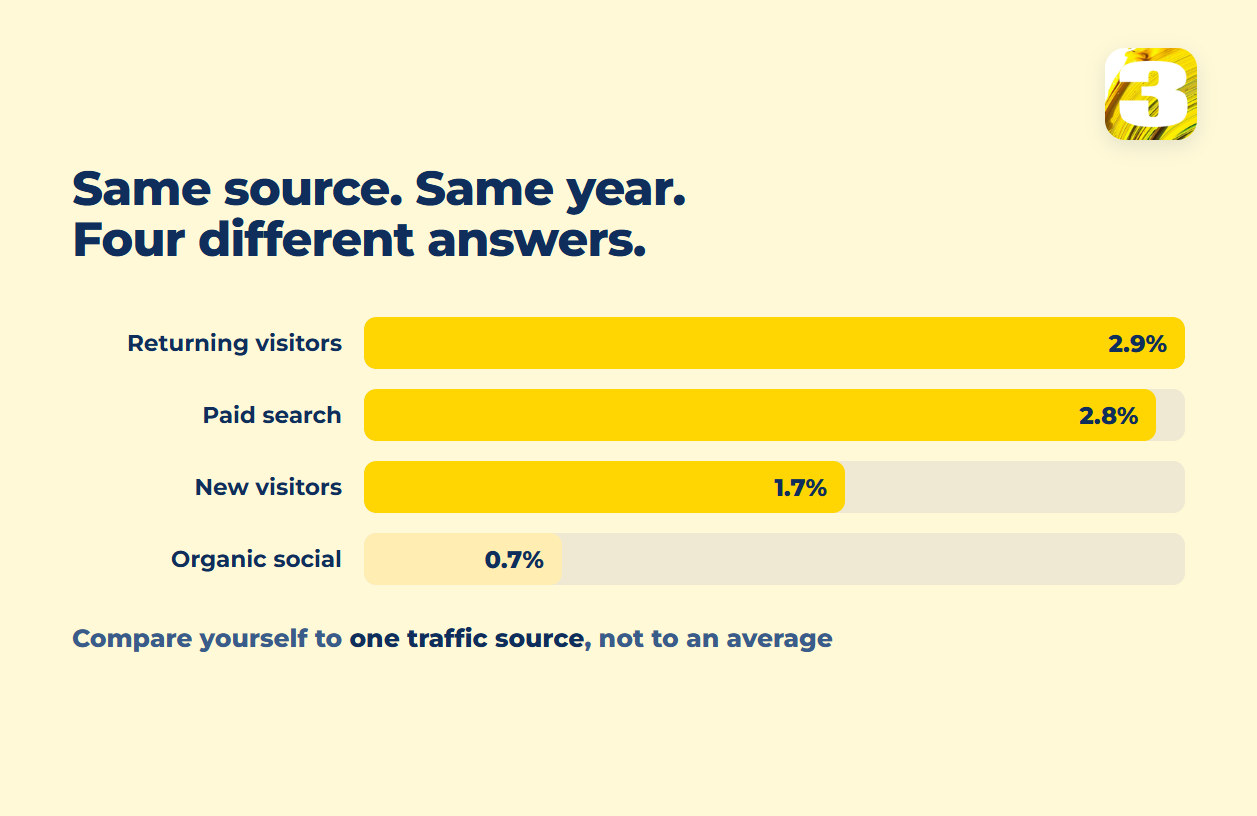
Contentsquare’s 2026 Digital Experience Benchmark makes the point a different way: it doesn’t publish one average at all. Instead it breaks conversion down by traffic type — returning visitors converting at 2.9%, new visitors at 1.7%, paid search at 2.8%, organic social at 0.7%. That’s a four-fold range inside a single dataset, before industry, season, or device enter the picture. If one vendor’s own traffic segments swing that much, “the average” was never a meaningful number to chase in the first place — what matters is which segment you’re actually comparing against.
Why an Industry Average Conversion Rate for Ecommerce Is the Hardest Number to Trust
Here’s the awkward part for anyone searching this exact phrase: the more finely a source slices by industry, the less reliable each slice gets. An overall average rests on a large pool of stores. Split that pool into fifteen categories and each one is now a smaller sample — sometimes much smaller — and no source we found publishes how many stores sit behind an individual industry row. One category’s figure might rest on hundreds of stores, the next on a handful. You can’t tell which, and it changes everything about what the number means.
Add the fact that “Fashion” at one source and “Apparel & Accessories” at another aren’t the same set of merchants, and industry tables become the least comparable numbers in the whole space — which is exactly why they’re the ones reprinted most often. They read as precise.
There are benchmarks that do break out by market, including North America — retail platforms publish quarterly indexes from their own merchant base. What we couldn’t find is one that states, in the open, how it counts a session, which stores are in the sample, and how the industry buckets are defined. Until a source tells you that, its number for your category is a number, not a benchmark.
What to Compare Your Conversion Rate Against Instead
Given all that, the useful comparison isn’t a published average — it’s your own store, one traffic source at a time, tracked the same way over time. Google Analytics 4 gives you two different metrics for this, and they’re not interchangeable: session key event rate (sessions that included a purchase, divided by all sessions) and user key event rate (the share of people who ever converted, divided by all users). A shopper who visits three times before buying moves those two numbers in opposite directions, and that alone accounts for a chunk of the disagreement between sources that don’t say which one they used. GA4’s documentation on key events covers both definitions if you want to check which one a report is quoting.
There’s also a quieter problem: your own number can be understated in ways a benchmark comparison won’t reveal. A purchase completed on-site shows up cleanly. An order that starts as a message and gets finished by a person doesn’t — unless someone is deliberately counting it. That’s part of why we run our own lead-tracking plugin: the standard toolset stops at the checkout, and inquiries arriving another way never land in anyone’s numerator.
For a fuller walk-through of where a store’s funnel leaks between the product page and the confirmation screen, see where shoppers actually leave a store, which takes it step by step — and if the real question is what to do when traffic is healthy and the numbers still aren’t moving, that conversation starts from scratch in what to fix first when traffic is high but leads aren’t. If it turns out the answer is a rebuild rather than a tweak, what a store costs and how we build one are the next things worth reading.
If you’ve got a number and no idea what to measure it against, send it over — tell us the platform, the traffic source, and the period, and we’ll tell you what it’s actually being compared to right now.