


A website heatmap is a color overlay on a screenshot of your page, showing where visitors clicked, tapped, and how far they scrolled before leaving. That’s the whole tool. It doesn’t tell you why someone clicked, whether they were happy, or whether the session ended in a sale. Everything past that is interpretation, and most of it goes wrong in a specific, predictable way. This is about the wrong ways, not about which vendor to sign up with.
Heatmaps for Website Pages: What the Red Zones Really Mean
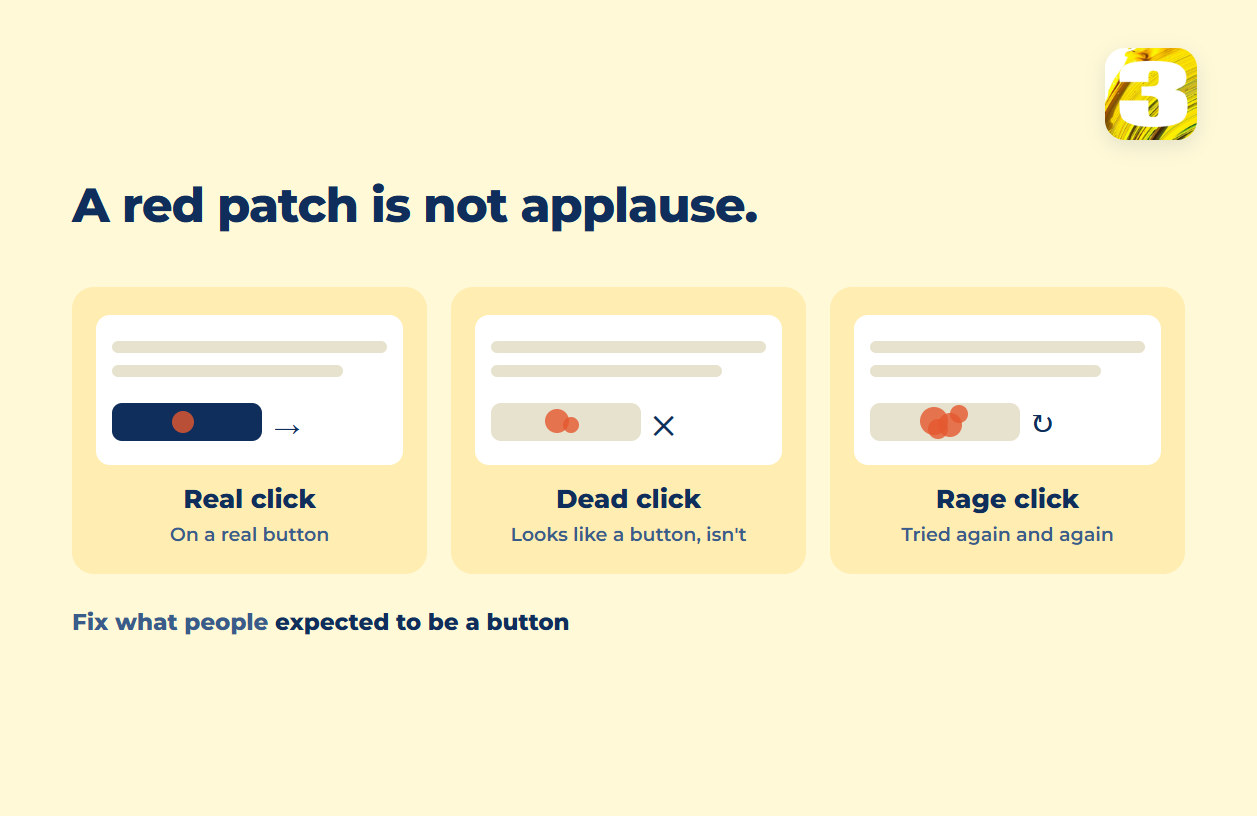
The most common misreading is treating a red cluster as approval. A heatmap registers clicks, and a click on something that isn’t clickable means the opposite of approval. A hot patch on a phone number that isn’t a link, a price that isn’t a button, or a product photo that doesn’t open a lightbox tells you one thing: visitors expected it to do something, and it didn’t.
Vendor documentation has names for this. A “dead click” produced no response at all. A “rage click” is several fast clicks in the same small spot — the signature of someone clicking harder because nothing happened the first time. Neither is a compliment, and both belong on the list of interface problems worth fixing first, covered element by element in 7 UI Errors That Quietly Kill Your Conversions.
One layer under that: on a computer the tool records mouse clicks, on a phone it records taps. Different physical actions, and a blended “click rate” describes two behaviors as if they were one.
What a Website Heatmap’s Scroll Map Leaves Out
A scroll map shows what percentage of visitors reached each point down the page. It looks like one clean gradient, but it’s quietly built from two different populations. A phone screen and a laptop screen show different amounts of the same page in the first view, so the same block of content sits at a different scroll depth on each device. Averaging desktop and mobile scroll data into a single map compares two different pages that happen to share a URL. Read them separately, or not at all.

A page with generous spacing simply takes more screens to scroll through than a dense one with the same content — which is why a scroll curve changes shape after a redesign, even when nothing was removed. We cover that in Why White Space Is Critical for High-Converting Landing Pages. What actually sits in that first screen — a static image, a headline, a video — changes what the scroll map is even measuring before anyone scrolls at all, which is its own decision covered in When to Use a Video Above the Fold (and When Not To).
How Many Sessions Before a Click Map Means Anything — and What to Do Instead
We went through the documentation of the five tools most people end up choosing between — Hotjar, Microsoft Clarity, Crazy Egg, VWO and Mouseflow — and none of them publishes a minimum session count before a heatmap is considered reliable. Search for a threshold and you’ll find blog posts guessing a number, not a published standard. The closest real figure comes from a different field entirely: Nielsen Norman Group’s guidance on lab eye-tracking studies puts stable results at around 39 test participants. But that’s a moderated lab session with equipment tracking eye movement, not a script logging clicks on a live site. Two different measurement methods happen to share the word “heatmap,” and that overlap explains most of the confusion. A click map built from a few dozen anonymous visitors on a low-traffic page isn’t a few dozen eye-tracking sessions — it’s a few dozen visits, some of which may be the same person twice.
Since there’s no published threshold to hit, our own rule of thumb is a test rather than a number: split the same date range into two halves — same device type in both — and see whether the hot spots appear in each. A pattern that survives the split is worth acting on. One that shows up in one half and vanishes in the other is noise, however red it looked on the combined map.
The One Thing a Heatmap Can’t Tell You
A heatmap records interaction, not outcome. It knows a visitor clicked the pricing tab. It has no idea whether that session ended in a submitted form, a phone call, or nothing at all. Two sessions can produce an identical click pattern, and only one of them is a customer.
That gap matters more than any color on the overlay, because it’s the question a business owner actually asks. It’s why the lead-tracking plugin we run on the sites we build is built differently on purpose: it records an inquiry as an inquiry and keeps its source. Without that, the heatmap tool sees a click and the ad platform sees a click, and nothing in the stack says which click became a customer. A heatmap is still useful for spotting a dead click. It just wasn’t built to answer “did this page convert,” and no setting in the heatmap view itself will change that — it has to be connected to whatever records your leads.
Fixing what a heatmap flags is one piece of a larger process — checking whether a conversion is even being counted correctly comes first, and that’s the starting point in what to fix first when traffic is high but leads aren’t.
Website Heatmap in Google Analytics: Why You Won’t Find One
If you came here after searching for a heatmap inside Google Analytics, the direct answer is that there isn’t one. GA4’s own list of Explore techniques — free-form, path exploration, funnel exploration, user explorer and four more — doesn’t include a heatmap, a click map, or a scroll map. Google did once offer a click overlay — In-Page Analytics, in the previous version of Analytics — but it was retired years ago and nothing equivalent was rebuilt in GA4. What exists now is a report builder, not a page overlay.
What GA4 does collect is close enough to cause the confusion. Enhanced Measurement logs a scroll event once a visitor passes 90% of page depth, and a click event for outbound links, automatically, with no setup. That data already exists in your account. What’s missing is the picture: GA4 will tell you what share of sessions fired the scroll event, but it won’t draw a page with a gradient over it. Need the number, it’s there. Need the picture, that’s a separate tool — with the same reading rules as above. The same account is also where broken conversion counting tends to hide, which is its own problem.
Where This Leaves You
A heatmap is a diagnostic, not a verdict. It’s good for spotting a dead click, a rage click, or a scroll drop-off worth investigating, and it has nothing to say about whether the page made money. That needs conversion data attached to the session — exactly what most heatmap installs are missing on day one. Stores hit a version of the same gap earlier, at the product and cart pages, and that’s its own topic in where shoppers actually leave a store.
If you’ve got a heatmap running right now and aren’t sure what the colors are telling you, send us the URL. We’ll tell you which spots are worth fixing and which are just people using their thumb.