


One contractor used to spread about 100 printed job sheets across his garage floor to find the one he needed. Map-based project tracking is what replaced that: every active job shows up as a point on a map instead of a row in a spreadsheet or a card in a list. The shape and color of the point tell you its status at a glance. Click it, and you get the full record — address, dates, scope, notes, photos, key milestones. For a contractor running dozens of jobs spread across a wide territory, that single change — from list to map — solves a problem that task managers and calendars were never built to solve: knowing where your work actually is.
This is a walkthrough of what that looks like in practice, built for a contractor running about 100 active sites at once. Not a pitch for a piece of software — a look at what changes when your projects live on a map instead of a list, and, just as importantly, when they don’t need to.
Below: what the setup actually contains, which tools on the market give you a real project map and which give you a map of people or a map of photos, what a build like this costs against a subscription, and when a map isn’t worth building at all.

From a Stack of Printouts to Points on a Map
Before the change, this contractor tracked every job on paper. Each site had a printout: address, measurements, scope of work, history of what had been done and when. When something needed checking — a measurement, a note from three weeks ago, whether a client had signed off on a change — someone pulled the right sheet out of a stack and read it.
That stack lived in a garage. A construction contractor near Montreal was managing roughly 100 active sites this way, spread across a territory that runs about 100 km north to south and 500 km east to west — call it 60 miles by 310 miles. 100 printouts, one garage floor, and a search every time a question came up about a specific job.
The system worked in the sense that the information existed and was, in theory, findable. It broke down as a way of seeing the business as a whole. There was no view that showed which jobs were active this week, which were finishing, which were stalled, or which three sites happened to be twenty minutes apart and could share a supply run. Paper holds detail. It doesn’t hold a picture of 100 jobs at once.
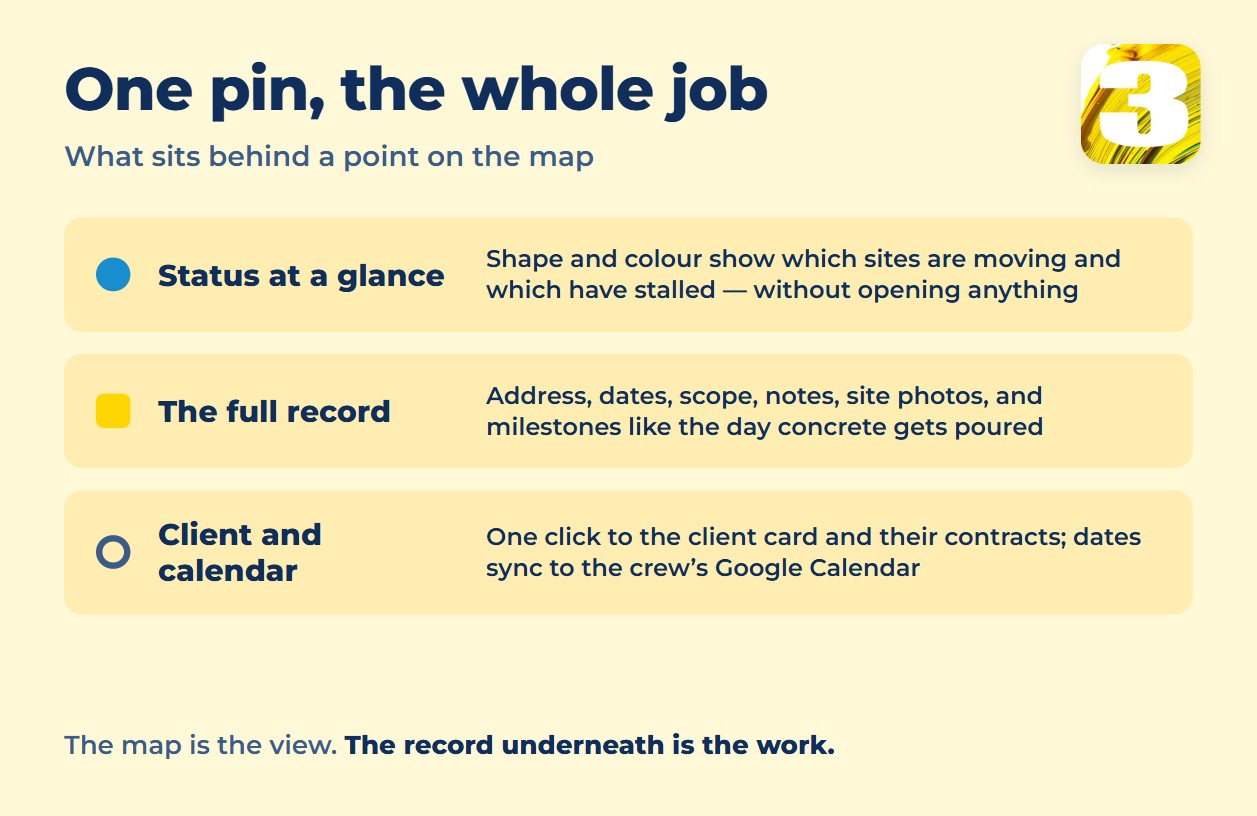
What replaced it: every site as a point on a map, positioned by its real address. Shape and color carry the status, so the state of the whole operation is visible without opening a single record. Filters narrow the map by status.

Click a point, and the full site card opens: address, dates, description, internal notes, links to job-site photos, and key milestones like the day concrete gets poured. From the site card, one click goes to the client record, and from there, to that client’s contracts.
The calendar — both the owner’s and the crew’s — syncs with Google Calendar. A date set on a site card shows up on the same calendar everyone already checks each morning.
What changed wasn’t the work on site. It was moving what already existed on paper into a structure that a map, not a filing system, could organize.
Why a Task List Stops Working Once Jobs Are Spread Out
Task lists and calendars are built around time. They answer “what’s due” and “when.” Neither one answers “where,” and for a business with one location, that’s fine — everything is where it is. Once jobs are scattered across a real territory, “where” stops being a background detail. It becomes the question that decides the day: which crew goes to which site, which jobs are close enough to combine into one trip, which project just fell off everyone’s radar because it’s two hours from the office and nobody drives past it.
A flat list of 100 rows doesn’t show geography. Scroll through it and every job looks the same distance away, whether it’s next door or 300 kilometers out. A calendar shows when something is scheduled, not whether it makes sense to schedule three jobs on the same day if they’re on opposite ends of the territory. Both tools describe the work. Neither one describes the map the work actually happens on.
That gap doesn’t matter at five sites. It starts to matter well before 100 — anywhere a business runs enough concurrent jobs that no one person can hold the full layout in their head. At that point, the map isn’t a nicer view of the same data. It’s the only view that answers the question dispatchers and owners actually ask each morning: what’s near what, and what’s easy to miss because it isn’t.
What’s Actually on the Map
Strip away the specifics of any one build, and a working map-based tracking setup for a contractor comes down to a small number of pieces, each doing one job:
- A pin per site, positioned by address. No manual placement, no separate spreadsheet of coordinates — the address on the record puts the point on the map.
- Shape and color for status. A glance at the full map shows which sites are moving and which aren’t, without opening anything.
- Filters by status. Narrow 100 points down to the dozen that need attention this week.
- A full record behind every point. Everything that used to be on the printout, in one place instead of a stack.
- A path from site to client to contract. The site card isn’t an island. One click takes you to who the client is; from there, to the paperwork tied to them.
- Calendar sync, not a separate calendar. Dates on a site card show up on the calendar the owner and crew already use — their own Google Calendar — instead of living in a system nobody opens on a phone in a truck.
Individually, none of these pieces is exotic. A CRM has client records. A calendar app syncs dates. A photo app links images to a job. What’s uncommon is having all of it hang off one map, so the geography of the business and the paperwork of the business are the same view instead of six different logins.
How the Printouts Became Pins
The part that decides whether a map like this survives contact with a working week isn’t the map. It’s where the data comes from and who keeps it current, because a map that someone has to remember to update stops being true in about a month.
The addresses arrive on their own. Requests come into the contractor’s email, and the address travels from the request into the system without anyone retyping it. That matters more than it sounds: manual entry is the step people skip when they’re busy, and the first skipped address is where a tracking system starts drifting away from reality.
Bad addresses don’t disappear — they just don’t get a pin. Not every request arrives with something a map can place. A lot on a road with no civic number, a description instead of an address, a typo. Those sites don’t vanish and they don’t sit in a silent error queue: they appear in a list below the map. Someone can type the address in by hand, and the site takes its place among the pins. That’s a small design decision carrying a lot of weight, because the alternative is a map that quietly shows 94 of your 100 jobs and never mentions the other six.
The status changes by dragging a card. Statuses live in the CRM as a kanban board. Someone moves a site from one column to the next as the work progresses, and the point on the map changes with it. There’s no second place to update and no new habit for anyone to build.
That last one answers the question every owner asks about a system like this: who is actually going to keep it current? The honest answer can’t be “the team will remember.” It has to be that keeping it current is the same action as doing the work.
Those three details are most of the difference between a map that gets used and a map that gets opened twice. The pins are the easy part.
What the Market Already Offers — and Where It Stops
A map view for construction and field service work isn’t a gap nobody’s filled. Several platforms already put pins on a map. What to check before picking one is what kind of map each of them actually builds, because “we have a map” covers at least three different products.
| Tool | What the map actually shows | What it costs to keep, per year at list monthly rates |
| Procore | A Portfolio Map with project pins, plus a separate Project Map, still in beta, that tracks incidents, inspections, and photos rather than the project record itself | Not published; priced by construction volume |
| Buildertrend | A project map, according to third-party write-ups of the product | Public pricing was pulled in 2026; third-party reviews put it anywhere from ~$339 to $1,099/mo → roughly $4,000–13,000/yr |
| Raken | A “Labor Map” showing how many people are on a site — a map of headcount, not of the project | ~$15 per user/mo per third-party reviews, not confirmed by the vendor → ~$180/yr per user |
| CompanyCam | A “Project Map” advertised as “all your jobs on a live map,” built around photo documentation | $119/mo from the Crew plan → ~$1,428/yr |
| Fieldwire | No portfolio-wide map; each project shows a single address, on its own | Pro $39/user/mo → ~$468/yr per user |
| Jobber | No persistent map view; route optimization for techs instead | Core $24/mo for the first year, then $29 → ~$288, then ~$348/yr; Connect $80/mo, then $99 → ~$960, then ~$1,188/yr |
| Housecall Pro | GPS tracking of technicians — a map of people in the field, not of jobs | Basic $59/mo → ~$708/yr; Essentials $149/mo → ~$1,788/yr |
| Contractor Foreman | No portfolio map listed; GPS geofencing at clock-in | Basic $49/mo, one user → ~$588/yr |
| Knowify | No map feature listed; geofencing only at clock-in | Core $99/mo → ~$1,188/yr |
| ClickUp | A Map view with pins coloured by status and priority; the pin opens a task, not a site record with a client and contract behind it | Not stated on the feature page |
Checked on vendor pricing pages in August 2026, except where a row says the number comes from third-party reviews — Buildertrend pulled its public pricing, Procore never published one. List rates × 12; annual plans discount some of these, and none of them include setup.
Two of those tools cost more in their first year than the build described here costs once. That’s the structural difference, and it matters more than any feature list: a subscription is a line item that keeps running whether the map earns its keep or not, and it grows with every seat you add. A workflow is a one-time build that runs on infrastructure we host, with no per-seat meter on it. It’s also yours to take — the workflows can be exported and handed over, though in practice most owners would rather someone else kept them running.
Four of these — Fieldwire, Jobber, Contractor Foreman, Knowify — never promised a portfolio map in the first place; they’re in the table because they come up in the same searches, not as failed competitors. Among the ones that do put jobs on a map, three patterns show up:
Maps of people, not projects. Raken’s Labor Map and Housecall Pro’s technician tracking show where crews and techs are right now. Useful for dispatch. It doesn’t show what state a project is in, what’s due on it, or what its history looks like.
Maps of photos, not records. CompanyCam’s map is a natural extension of what the tool is for — job-site photo documentation, pinned to location. It’s a strong photo tool with a map layered on top, not a project-tracking system with photos attached.
Maps of tasks, not sites. ClickUp’s Map view pins work by status and priority, which is genuinely close — until you click one and get a task rather than a site record with measurements, a pour date, and the client’s contract hanging off it.
Products in roughly this shape do exist, and more of them appear every year. So the useful question isn’t “does anything put my jobs on a map” — plenty does. It’s whether the thing on the other side of the pin holds the fields you actually keep on those printouts: the measurements, the date the concrete went down, the paperwork for the client who owns the site. That’s the line where off-the-shelf ends and a build starts, and it sits in a different place for every contractor.
If one of these does exactly what you need, buy it — off-the-shelf will always be cheaper than building. The question worth asking first is what happens to the part that doesn’t fit. With a subscription tool you file a feature request and wait. With a workflow you change it.
It Isn’t Only a Construction Problem
The example here is construction, because that’s the build we can describe in full. The shape of the problem isn’t specific to it. Any business whose work happens at addresses rather than in an office runs into the same wall, usually at the same moment: when the number of open jobs passes what one person can picture at once.
Landscaping and paving crews, where the route between sites decides how many jobs fit in a day. HVAC and plumbing contractors carrying dozens of open service addresses, each with its own equipment history. Property managers with units across a city, where the question is which building has three open issues and which has none. Roofing and solar installers working a seasonal territory. Inspection and survey work, where the record attached to a location is the deliverable. Franchise operators opening locations in sequence, each at a different stage of build-out.
What these have in common isn’t the trade. It’s that the same three facts matter for every job — where it is, what state it’s in, and what’s already been done there — and that a list can hold two of them but not the first.
The differences are in the fields, not the structure. A landscaper’s site card wants access notes and irrigation zones. A property manager’s wants unit numbers and tenant contacts. An inspector’s wants the last report and the date it’s due again. The map, the statuses and the link from site to client stay the same; what hangs off the pin changes completely. That’s the part worth thinking through before anyone builds anything, and it’s the reason an off-the-shelf tool built for one trade often fits another one badly.
When a Map Isn’t Worth Building
Earlier I said the gap doesn’t matter at five sites. That cuts both ways: below the point where geography is something you actively manage, a map isn’t worth building at all. And the honest test isn’t a site count — it’s whether anyone on the team currently loses time working out where things are.
If your business runs one project at a time, or a handful, and a single crew handles all of them in one city, a map adds a layer of setup and screen real estate for information you can already hold in your head or see on a whiteboard. A task list with due dates does the job. A shared calendar does the job. The map’s advantage — turning geography into a picture — only shows up once geography is actually a variable you’re managing, not a constant.
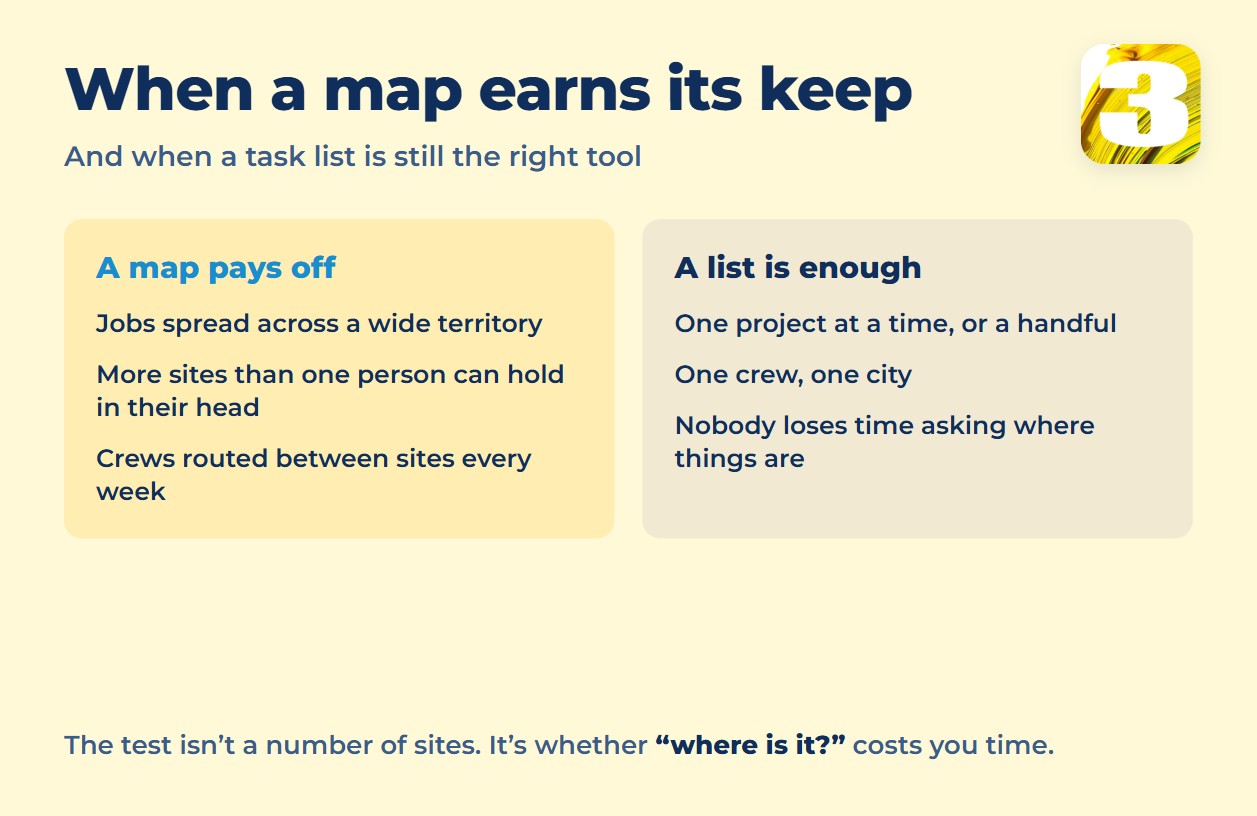
Which jobs are near each other? Which one hasn’t been touched in a while because it’s out of sight? If nobody is losing time on those questions, a map won’t change much, and the cheaper next step is a single workflow that removes whatever you currently re-type twice — what that costs is here.
What This Costs
At 3MY, we build automation as individual workflows, not as a platform subscription. A setup like this one runs on our own infrastructure, wired into the tools a business already uses — its calendar, its client records — rather than replacing them. There’s no per-seat licence and no monthly platform fee riding on top.
What that means when you leave matters as much as what it costs to start. The workflows are exportable and can be handed over, and they will run elsewhere. In practice, most owners would rather someone kept them running than take them in-house, so it’s worth deciding which of those you want before the build, not after.
One workflow runs $800. Up to three workflows — say the map view, the calendar sync, and the client-to-contract link — run $1,500. Canadian clients are quoted in CAD, U.S. clients in USD. Build time is usually one to two weeks, most often two, and depends on the specifics of the project rather than being fixed in advance.
For the fuller breakdown of how that pricing works and what changes the number, see how much workflow automation actually costs.
If Your Job List Doesn’t Show You Where the Work Is
The map itself is the visible part. What makes it work is everything underneath — the site records, the status logic, the link from a pin to a client to a contract, the calendar that stays in sync without anyone re-entering a date twice. That’s the part that has to fit how a specific business already tracks its jobs, because no two contractors keep the same information in the same places.
We’ll tell you plainly whether a map-based setup is the right next step or whether something simpler would do the job.