


ACoS = (ad spend ÷ ad sales) × 100
ROAS = ad sales ÷ ad spend — or 100 ÷ ACoS
Break-even ACoS = your gross margin after Amazon’s fees, as a percent
Amazon’s own advertising guide says it outright: “There isn’t a definitive number for a good Amazon ACOS. It’s dependent on your industry, company size, and campaign frequency.” That sentence should settle most of what you’ll read in forums and blog posts about “the right ACoS.” There isn’t one, universally. A candle brand selling at a 70% margin can run profitably at a 45% ACoS. A commodity electronics reseller on a 12% margin would be underwater at anything above 12% — barely a quarter of that, on the exact same platform.
The question “what’s a good ACoS” is the wrong question. The right one is: what ACoS can you afford, given what Amazon actually lets you keep from each sale? That number comes from your own price, your own cost of goods, and Amazon’s own fee schedule — not from a benchmark someone else published.

ACoS and ROAS Are One Number, Read Backward
ACoS and ROAS describe the same relationship from opposite directions. ACoS asks: for every dollar of sales, how many cents went to ads? ROAS asks: for every dollar spent on ads, how many dollars came back? Convert one to the other with a single step: ROAS = 100 ÷ ACoS.
| ACoS | ROAS |
| 50% | 2.0× |
| 33% | 3.0× |
| 25% | 4.0× |
| 20% | 5.0× |
Amazon’s own guide to ROAS calls 2:1 the “current industry average” and recommends aiming for 3:1–4:1. Run that through the formula above and Amazon’s own recommended range works out to roughly a 25–33% ACoS — which is exactly why quoting “average ACoS” as one number is misleading: Amazon’s own reference point already spans a wide band before your category, your margin, or your goals enter the picture.
Practically, you only need to track one of the two. Improving ACoS improves ROAS by definition, and vice versa. Pick whichever one your team already reports in and stop switching between them mid-conversation.
One thing worth settling before the rest of this article: Sponsored Products and Sponsored Brands are billed per click, not per impression — you’re charged only when a shopper clicks, and Amazon collects once your clicks total the first $1.00 or you hit your credit limit. Sponsored Display is self-service too and can be run on the same per-click basis. There’s no separate fee for the ad platform itself — advertising comes with a Professional selling account, which is $39.99 a month — and no minimum spend commitment, so the entry cost is whatever you set as a daily budget. The one exception is Amazon DSP as a managed service, which is a different product entirely and typically starts around $50,000. Everything below is about the self-service formats.
TACoS Isn’t an Amazon Metric — There’s No Report for It
TACoS (Total Advertising Cost of Sale) gets treated like an official metric in a lot of seller guides. It isn’t one. Amazon’s own ACoS page doesn’t mention the word. There’s no TACoS report in Seller Central, no column for it in Business Reports, no toggle to turn it on.
The formula itself is simple: TACoS = (total ad spend ÷ total revenue, ads plus organic) × 100. You calculate it by hand — total ad spend from your advertising console, total ordered product sales from Business Reports, same date range, divided one by the other. Nothing pulls it for you.
The reason it’s worth the manual work: ACoS only tells you whether one campaign is efficient. TACoS tells you whether advertising is actually lowering your blended cost of a sale over time, or whether you’re just paying to win back organic sales you’d have gotten anyway. A brand-new listing with a 60% ACoS and a low TACoS is usually fine — it’s still small relative to total revenue, and it’s building the organic ranking that will eventually need less ad support. The same 60% ACoS on a five-year-old listing with a flat TACoS is a different conversation.
The Full Cost of Selling on Amazon (Ads Are Rarely the Biggest Line)
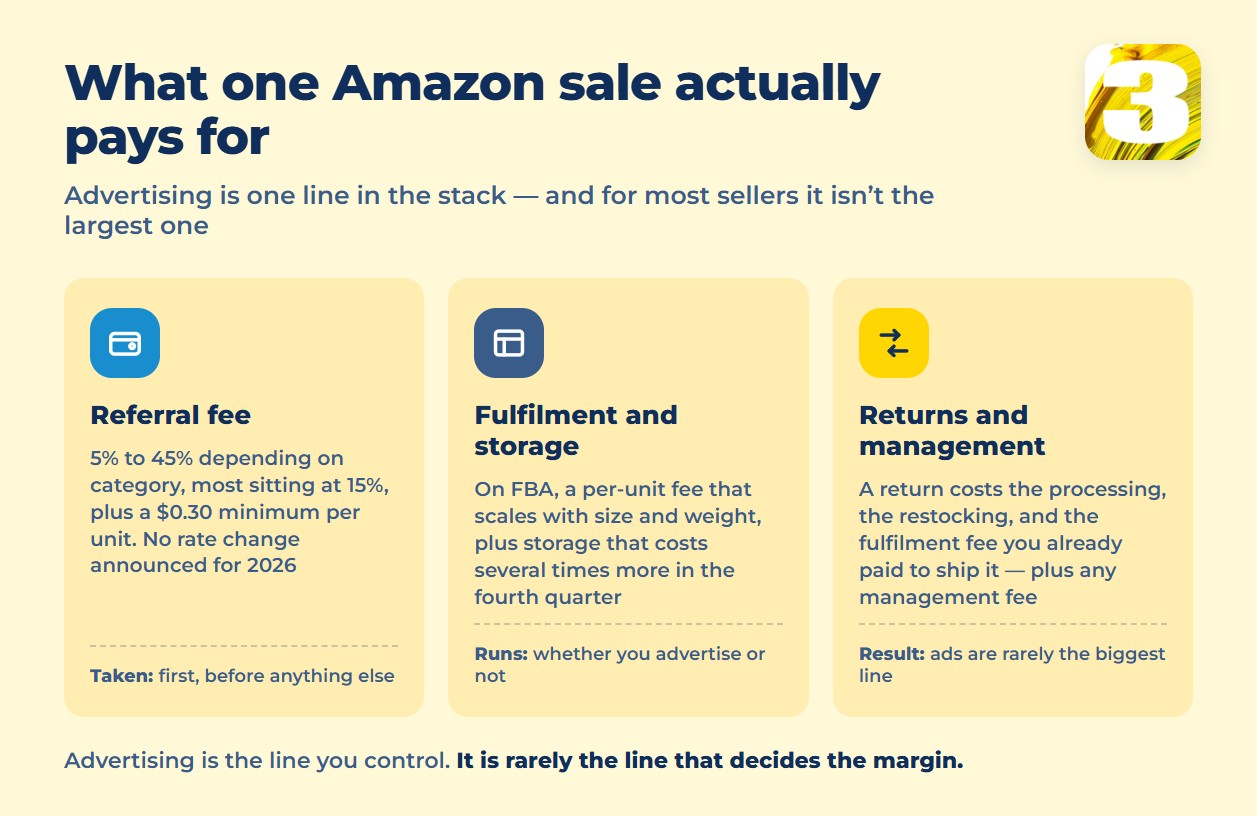
Before ad spend touches anything, Amazon takes a referral fee on every sale. Amazon’s 2026 fee update flagged fulfillment fee increases and said nothing about referral fees — so referral rates aren’t announced as changing, which isn’t quite the same as a published guarantee that they won’t.
| Category | Referral fee |
| Amazon Device Accessories | 45% |
| Electronics / Computers | 8% |
| Beauty / Health / Personal Care | 8–15% (tiered by price) |
| Clothing & Accessories | 5–17% (jumps at $20) |
| Home & Kitchen | 15% |
| Sports & Outdoors, Toys & Games, Pet Supplies | 15% (22% for pet vet diets) |
| Everything Else (default) | 15% |
Most categories also carry a $0.30 minimum referral fee per unit, regardless of price — the current rate card sits on Amazon’s pricing page.
If you’re on FBA, fulfillment and storage fees stack on top of the referral fee — seller-tool rate guides that track Amazon’s published cards put standard-size fulfillment in the $3–7 range per unit depending on weight, plus a fuel surcharge of roughly 3.5% added to FBA fees in the U.S. and Canada starting in April 2026. Storage fees swing hard by season on those same rate cards: standard-size storage is quoted around $0.78 per cubic foot from January through September and about $2.40 through the fourth quarter, and inventory sitting past 181 days picks up an aged-inventory penalty that starts near $0.50 per cubic foot and climbs sharply the longer it sits. None of this is officially confirmed on an Amazon page we could open without a seller login, so treat the exact dollar figures as directionally right, not gospel — but the shape is not in dispute: fulfillment and storage are real, ongoing costs that exist whether or not you run a single ad.
Returns cost money too — processing, restocking, and the fulfillment fee you already paid to get the unit to a customer who sent it back. Add whatever you pay an agency or a freelancer to manage the account, and you have the full stack: referral fee, fulfillment, storage, returns, management fee. Advertising, measured as ACoS, is one line in that stack — and for a lot of sellers, not the largest one.
What’s a Good ACoS? The Only Honest Answer Is Your Break-Even
Before building your own number, it’s worth knowing what the published “averages” actually are and where they come from. Ad Badger reports a roughly 29.6% average across its own client base, with a spread from about 21% in Food and Grocery up to 42% in Clothing and Apparel. Autron, working from its own dataset, puts the average nearer 34%. One of the aggregators publishing these figures says the quiet part out loud: no single definitive public dataset of ACoS by category exists — these are directional aggregates drawn from whoever happened to be using that particular tool, not a census of Amazon sellers.
That’s the real reason to skip benchmarks. Not that they’re useless, but that two of them disagree by more than four points before your product, your margin, or your category enters the picture. Build your own number instead.
Take your selling price, subtract cost of goods, subtract the referral fee for your category from the table above, subtract a rough per-unit estimate for fulfillment and storage. What’s left, as a percent of price, is your gross margin before advertising touches anything — and that percentage is the hard ceiling. Spend more than that on ads, per sale, and every ad-driven order loses money, no matter what the ACoS number “looks like” compared to someone else’s.
| Gross margin before ad spend | Break-even ACoS (zero profit on ad sales) | ACoS ceiling if you want a 10-point profit margin |
| 20% | 20% | 10% |
| 30% | 30% | 20% |
| 40% | 40% | 30% |
| 50% | 50% | 40% |
| 60% | 60% | 50% |
This is why “what’s a good ACoS” can’t be answered from a category benchmark alone: a 35% ACoS is a losing number at a 20% margin and a comfortable one at a 50% margin, same platform, same auction, opposite outcome.
Two things move you up or down this table without touching a single bid. One is what you actually keep per sale — the fee stack above. The other is how well the listing converts once the click lands. A page converting at 8% needs half the clicks — and roughly half the spend — to hit the same number of sales as one converting at 4%. Main image quality and A+ Content are two levers most sellers leave untouched: see our breakdowns on Amazon image requirements and A+ Content modules.

A Nine-Month Case: The Real Monthly Numbers
Here’s what break-even thinking looks like against a real campaign, not a hypothetical. One product, new to Amazon, one marketplace, nine months. The work was done by two specialists who are on the 3MY team today. The brand isn’t ours to name — the owner allowed the numbers to be published, not the name — and we’re not pasting screenshots either. The table below is the actual monthly spend and sales, which tells you more than a screenshot would anyway.
| Month | Spend | Ad-driven sales | ACoS |
| 1 | $479 | $738 | 65% |
| 2 | $4,588 | $9,886 | 46% |
| 3 | $4,357 | $10,639 | 40% |
| 4 | $40,653 | $127,329 | 31% |
| 5 | $72,718 | $238,818 | 30% |
| 6 | $6,635 | $23,958 | 27% |
| 7 | $4,102 | $15,816 | 25% |
| 8 | $12,185 | $37,666 | 32% |
| 9 | $23,837 | $75,283 | 31% |
Across the nine months: $169,554 in spend, $540,133 in ad-driven sales, a weighted ACoS of 31.4%, ROAS 3.19×. Monthly ACoS is shown as reported, rounded down to the whole percent — divide any row yourself and you’ll land a fraction higher.
One product, one category, one nine-month window. This is how the numbers behave, not a target for yours — which is the same reason we told you to ignore category benchmarks a few paragraphs ago.
Four things this table shows that a case-study slide wouldn’t:
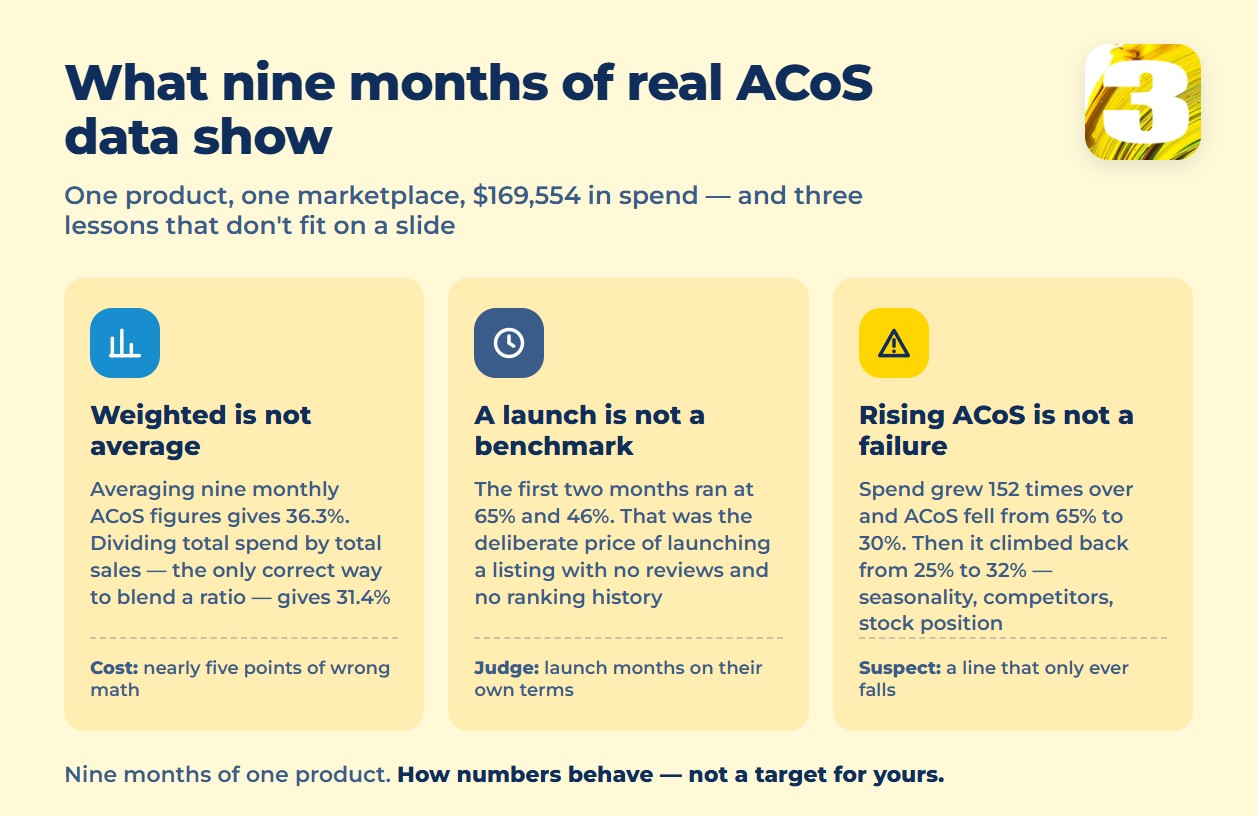
A weighted ACoS is not the average of monthly ACoS values. Add up the nine monthly percentages and divide by nine, and you get 36.3%. Divide total spend by total sales instead — the only correct way to blend a ratio — and you get 31.4%. Nearly five points of difference, for free, just by using the right math. If your reporting shows a simple average of monthly ACoS, it’s overstating your real number.
The first two months ran at 65% and 46%. At a 65% ACoS, only an unusually high-margin product breaks even — launch months are normally paid for out of pocket, and that was the deliberate cost of launching a brand-new listing with no reviews and no ranking history. Judging a launch month against a mature-listing benchmark is comparing two different jobs.
Spend grew 152 times over, and ACoS didn’t fall apart. Month 1 to month 5, spend went from $479 to $72,718. Scaling usually costs efficiency, because the cheapest, best-converting keywords go first. Here it went the other way, from 65% down to 30% — one product over nine months doesn’t prove it always will.
ACoS climbed at the end, from 25% up to 32%, and that’s not a malfunction. Numbers move both directions inside a healthy account — seasonality, competitor activity, and inventory position all push ACoS up some months without anything being broken. A report that only ever shows a falling line is worth a second question.
What this table doesn’t show, on purpose: this product’s profit, margin, or break-even ACoS — we don’t have its cost of goods or full fee stack, and estimating either would violate the rule we just spent this whole article explaining. Same reason there’s no TACoS for it: we don’t have this product’s total revenue across organic and ads.
Where an Agency Actually Moves ACoS — and Where It Doesn’t
There’s a cheap way to lower ACoS: spend less. Cut a budget in half and ACoS usually drops, because the campaigns still running are the ones that were already converting well, and the ones that got cut were dragging the average down. Sales volume usually drops too — often by more than spend did. An agency that reports “ACoS down 20%” without also reporting what happened to sales volume isn’t reporting a win. It’s reporting a smaller campaign.
So the question to ask anyone promising you a lower ACoS is not whether they’ll commit to a number — it’s what the number is measured against. A commitment worth having names the sales volume it has to be achieved at, spells out what counts as the starting point, and lives in the contract rather than on a slide. Ours does: the terms are agreed per account before we start, in writing. A percentage quoted with none of that attached is the cheap version, and it’s the one you should push back on.What genuinely moves the number without shrinking the campaign: negative keywords that stop paying for clicks that never convert, bid structure that matches how each match type actually behaves, and — more than either of those — what happens after the click. Whether your product wins the Featured Offer decides whether there’s a working “Add to Cart” button behind the ad at all; losing it can sink ACoS on a campaign that hasn’t changed a single setting. The words the ad is actually targeting decide whether the right shopper clicks in the first place — that’s keyword research built from what shoppers actually search, not guesswork. Neither of those shows up if you only ever look at the ACoS number in isolation.
That’s what end-to-end Amazon ad management means: bids and budgets, but also the listing and targeting work that changes the denominator — not just the number on top.
Starting Budget and What We Charge
We charge a flat monthly fee for managing Amazon Ads, not a percentage of your spend. A percentage fee gives an agency a reason to want your spend higher, regardless of what that does to your ACoS — we’d rather not have that incentive in the room.
- Starter: $590/month
- Growth: $1,190/month
- Enterprise: priced by ad spend volume, quoted per account
For a new listing, we typically recommend starting at $1,000–1,500/month in ad spend — enough to generate the clicks a bidding algorithm needs to learn from, without betting an entire launch budget on the first few weeks. Amazon itself sets the floor far lower — its Sponsored Products budget guidance recommends a minimum of about $10 per campaign, and its FAQ puts the technical minimum daily budget at $1.00. Those are the limits of what the system accepts, not the level at which a launch generates usable data.
What’s Your Break-Even ACoS?
You don’t need someone else’s benchmark to answer that — you need your margin, and the arithmetic above takes one subtraction. The harder question is the second one: how far a live campaign has drifted from that ceiling, and which part of it is doing the drifting.
Send us your price and your category, plus your product cost if you’re comfortable sharing it, and we’ll work out the ceiling and show you where a current campaign is running past it. No call required for that first look.