


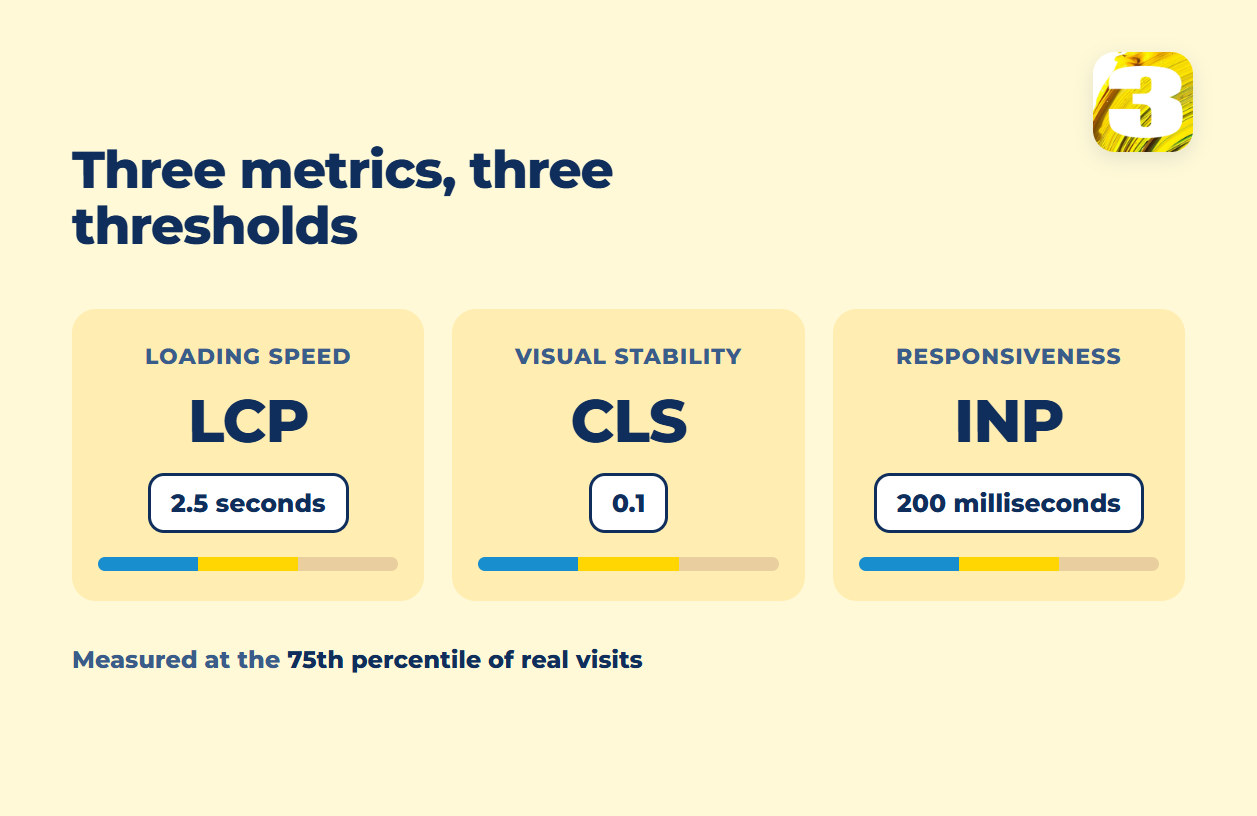
Core Web Vitals are three measurements Google uses to describe how a page feels to use, not how it looks or reads. Largest Contentful Paint (LCP) times how fast the main content shows up. Cumulative Layout Shift (CLS) tracks how much the page jumps around while it loads. Interaction to Next Paint (INP) measures how quickly the page responds once someone actually clicks or taps something. Each has a published number for “good,” “needs improvement,” and “poor.”
None of the three measures whether a page converts, whether the copy is any good, or whether the design is on-brand — only whether the page is pleasant to use on a real device, on a real connection, on the first visit.
None of this is subtle to a visitor, even if they’ve never heard the term. A page that takes four seconds to show its headline feels slow before anyone reads a word of it. A page where the “Add to Cart” button jumps an inch to the right the instant someone taps it just gets tapped again, on the wrong thing. A menu that takes half a second to open after a tap feels broken, not just slow. Core Web Vitals puts numbers on exactly those three moments.
The Three Metrics and Their Thresholds
All three are measured the same way: at the 75th percentile of real visits to a page, tracked separately for mobile and desktop. That detail changes what the number means. A site isn’t graded on its best load or its average load — the bar is set by the slower end of that spread: a page passes only if three out of four visits come in under the threshold, which is far less forgiving than an average would be.
“To ensure you’re hitting this target for most of your users, a good threshold to measure is the 75th percentile of page loads, segmented across mobile and desktop devices.”
That’s from web.dev’s page on Largest Contentful Paint, and the same percentile rule applies to all three metrics.
| Metric | What it measures | Good | Needs improvement | Poor |
| LCP — Largest Contentful Paint | Time until the largest visible element finishes rendering | 2.5s or less | 2.5–4.0s | over 4.0s |
| INP — Interaction to Next Paint | Delay between a tap and the moment the page visibly responds | 200ms or less | 200–500ms | over 500ms |
| CLS — Cumulative Layout Shift | How much visible content moves without warning | 0.1 or less | 0.1–0.25 | over 0.25 |
Largest Contentful Paint: How Fast the Main Content Loads
LCP isn’t about the whole page finishing — it’s about the single largest thing a visitor can see: usually a hero image, a video poster frame, or a large block of heading text. The moment that element is fully rendered is the number that counts.
The most common way we see LCP fail on a first screen is a slider. A rotating banner has to load several images (or a video) before the browser can even settle on which element is “largest,” and that decision delays the paint for everyone, on every device, regardless of connection speed. A single, well-sized hero image gives the browser one thing to render instead of several — which is why it beats a slider here, however good the slider looks.
The fix isn’t always a redesign. Compressing the hero image, serving it in a modern format, and making sure nothing else on the page loads ahead of it in the queue can move LCP from poor to good without touching the layout at all. It’s only when the largest element is genuinely competing with several others for the same slot — a slider, a video background, a carousel of testimonials up top — that the fix becomes structural.

Cumulative Layout Shift: How Much the Page Jumps Around
CLS measures movement, not speed. It penalizes a page where text jumps because a web font swapped in late, where a button slides down because a banner appeared above it, or where an image collapses the layout around it because its dimensions weren’t known ahead of time.
The single most common cause we run into is a cookie or consent banner that gets injected by a script after the rest of the page has already settled into place. The layout looks fine until that banner shows up and pushes everything below it down by a few hundred pixels — and CLS counts every one of those unannounced shifts, for the entire time the page stays open, not just during the initial load.
Ads and third-party embeds cause the same problem from a different angle. A social media post, a review widget, or an ad slot that doesn’t reserve its final size will drop into the page after everything around it has already rendered, shoving the rest of the content down. Reserving a fixed height for that slot before the embed loads — even an empty one — removes the shift without removing the embed.
Interaction to Next Paint: How Fast the Page Responds
INP measures the gap between an action — a click, a tap, a key press — and the moment the browser visibly updates in response. It isn’t limited to the first click of a visit; it looks at interactions across the whole time someone spends on the page, and reports the slowest one that still counts as typical.
“An INP below or at 200 milliseconds means a page has good responsiveness… An INP above 500 milliseconds means a page has poor responsiveness.”
That threshold comes straight from web.dev’s documentation on the metric.
INP is the newest of the three. It replaced an older metric called First Input Delay in March 2024, so if a checklist or an old blog post still lists “FID” as a Core Web Vital, or claims the good threshold is under 100 milliseconds, it’s describing a metric Google retired.
On e-commerce pages, the interactions we see fail are the commercially important ones: adding an item to a cart, opening a size or color filter, expanding a product image. If the script behind any of those actions is also loading everything else the page might eventually need, the click has to wait behind work that has nothing to do with it.
Does a Google Core Web Vitals Score Affect Rankings?
Yes, but not the way it’s usually described. Google has been specific about this, on the record, more than once:
“Core Web Vitals are used by our ranking systems. We recommend site owners achieve good Core Web Vitals for success with Search and to ensure a great user experience generally.”
That’s the whole claim, from Google’s page experience documentation: Core Web Vitals is one input among many, recommended for a reason that’s mostly about the visitor, not the ranking. The same page is equally direct about the limits of that input:
“There is no single signal. Our core ranking systems look at a variety of signals that align with overall page experience.”
And, a few lines later:
“…there’s more to great page experience than Core Web Vitals scores alone.”
Google has never published a weight for this factor, and it doesn’t call a poor score a penalty — there’s no fine for failing, and no promise of a ranking jump for passing. Fixing Core Web Vitals is worth doing because it changes what a visitor experiences on your page. It isn’t a lever with a guaranteed position attached to it.
Why PageSpeed Insights Shows 92 While Search Console Is Red
This is the mismatch behind most of the confused questions we get about these numbers, and it isn’t a bug in either tool — it’s two different kinds of measurement answering two different questions.
PageSpeed Insights, run on demand, produces a lab score: one simulated visit, on one simulated device and connection, at the moment you ran the test. Search Console’s Core Web Vitals report, and the “field data” shown at the top of a PageSpeed Insights result, come from the Chrome UX Report — real visits from real people, collected over a rolling 28-day window. A page can score 92 in the lab and still show up red in the field, for reasons that have nothing to do with either tool lying:
- A lab test usually runs with a cold cache; a returning visitor’s browser already has your logo, fonts, and stylesheet cached, and a first-time visitor doesn’t.
- The element the lab identifies as “largest” isn’t always the element real visitors see — a different viewport, a personalization script, or an A/B test can swap it out entirely.
- INP genuinely cannot be measured in a lab, because there’s no real person clicking anything. Field data is the only source for it.
- CLS in the field is tracked for the whole time a real page stays open, including shifts caused by scrolling and by things loading in late — the lab only watches the initial load.
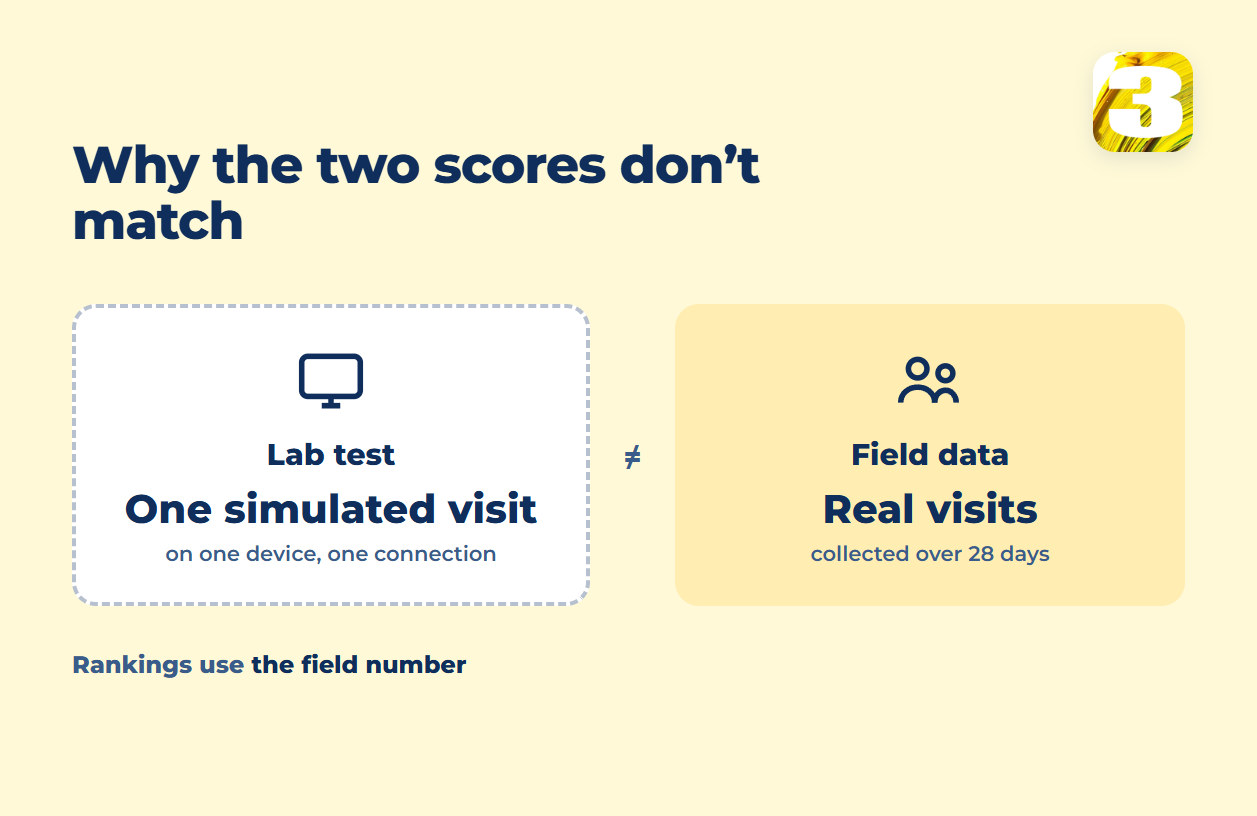
Ranking systems look at the field number, not the lab number. A lab score of 92 is a useful diagnostic — it tells you where to look — but it isn’t the score anyone else is judged by, and it isn’t proof that a real visitor found the page usable.
What Usually Causes Each Metric to Fail — and What Fixes It
Not every red metric needs the same kind of work. Some of it is a setting you flip. Some of it means rebuilding a section. Some of it isn’t fixable without changing where the site lives.
| Metric | Typical cause | Usually fixed by |
| LCP | Hero slider or video loading several assets before the browser can render anything | Rebuilding the first screen |
| LCP | Fonts, tracking scripts, or a page builder’s full stylesheet loading before visible content | Settings or build |
| CLS | Cookie or consent banner injected without space reserved for it | Settings |
| CLS | Images, ads, or embeds without a defined width and height | Build |
| INP | A theme or builder running its entire script library on every click instead of just what’s needed | Build |
| INP | Chat widgets, heavy trackers, or third-party scripts competing for the same thread | Settings — remove or delay |
| All three | Shared hosting slowing down under normal traffic | Hosting |
Reading a report line by line only gets you the symptom. Whether that symptom is a five-minute setting or a section that needs to be rebuilt is the part a checklist can’t answer for you — and it’s the difference between a small fix and a real project.

How to Run a Core Web Vitals Test on Your Own Site
Two free tools cover almost everyone:
- PageSpeed Insights — paste in a URL, get a lab score immediately, and field data if the page has enough traffic to have any.
- The Core Web Vitals report in Search Console — groups your pages by template and shows which ones are Good, Need Improvement, or Poor, using the same 28-day field window Google’s ranking systems use.
If a brand-new site, or a low-traffic page, shows no field data at all in either tool, that isn’t broken — it’s expected. The Chrome UX Report needs a minimum volume of real visits before it will report anything for a given page, so a page that launched last week, or one that gets a handful of visits a month, simply hasn’t accumulated enough traffic yet. Test it in the lab, watch the field data fill in as traffic grows, and don’t read a blank field report as a failing one.
Where We See These Numbers Before They’re a Problem
We see Core Web Vitals long before a client opens a report on them, because the decisions that decide LCP and CLS are decisions we make anyway when we build a first screen: a single hero image instead of a slider, a cookie banner with its space reserved from the start, a menu that doesn’t drag in a whole component library’s worth of script just to open. Getting those decisions right at build time is a different job than diagnosing them after the fact on a page nobody’s structure was designed around.
That’s also where the honest answer sometimes isn’t a setting at all. If a slow LCP or CLS score traces back to how a page is built rather than how it’s configured, tuning settings on top of that structure has a ceiling, and templates old enough to hit it are often cheaper to rebuild than to keep patching — our own sites start at $1,900 for up to eight pages, copywriting included. That order of operations, and the point where rebuilding wins out over further tuning, is the subject of the order speed fixes should follow. If the platform underneath is WordPress specifically, the causes unique to it are covered in WordPress speed optimization.
If the page in question is running paid traffic, a poor Core Web Vitals score also shows up inside Google Ads itself, as part of the landing page experience rating — which raises what you pay per click before a visitor ever reaches the page. And if you’re building a new landing page from the ground up, the same first-screen decisions covered here are half of what separates a page that performs from one that just looks finished.
We build business websites rather than write reports on them, which is why these numbers come up on our end at the drafting stage, not months later in an audit.
Run your own address through PageSpeed Insights or the Core Web Vitals report in Search Console first — field data, not the lab score. If it comes back red and you want a second opinion on whether that’s a setting or a structure problem, send it over.