


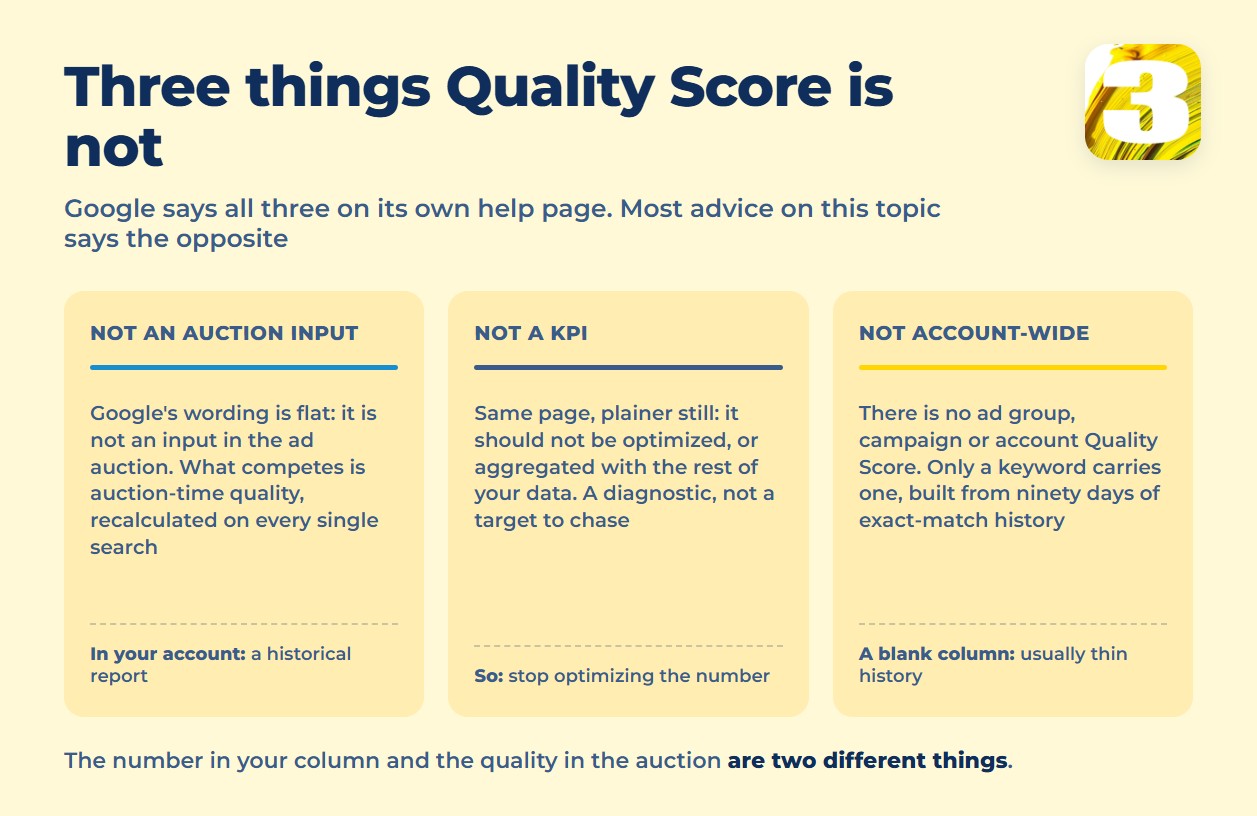
If someone told you your Quality Score is low and that’s why your clicks cost so much, here’s a sentence Google put in its own support documentation, plainly:
“Quality Score is not an input in the ad auction.”
And a second one, stronger, that almost none of the advice on this topic repeats:
“Quality Score is not a key performance indicator and should not be optimized or aggregated with the rest of your data.”
That isn’t a loose paraphrase from a blog. It’s Google, on its own help page, telling advertisers not to optimize the number that most of the search results for this exact query tell you to chase. If you came here for a seven-step plan to push your score from 4 to 9, this article won’t give you one, because Google itself says that number isn’t the lever you were told it is. What follows is what Quality Score actually measures, why the column in your account is probably blank on half your keywords anyway, and what genuinely moves what you pay per click.
What Quality Score Actually Is (And Isn’t)
Quality Score is a diagnostic, measured on a 1–10 scale, and it only exists at the keyword level. There’s no ad-group version, no campaign version, no account-wide version of it — just a number attached to a specific keyword in a specific ad group.
It’s built from three components: expected clickthrough rate, ad relevance, and landing page experience. Each one gets its own status — Above average, Average, or Below average — based on how your ads compared with other advertisers who showed for the exact same search over the last 90 days. Google is direct about what this number is for: “It’s a diagnostic tool to identify how ads that show for certain keywords affect the user experience.” A diagnostic, not a dial you turn to buy cheaper clicks.

The Three Components, and the One Real Question for Each
The useful question for any of these three isn’t “how do I raise it.” It’s simpler: can you actually change this from inside your account, and if so, how long does that take?
| Component | What it shows | What actually fixes it | Time cost |
| Expected CTR | How likely your ad is to get clicked on that exact keyword, compared with other advertisers on the same search — irrespective of your ad’s position, assets, or format | Almost nothing in your control; it’s a comparison against competitors on the same query, not a setting you own | Weeks of watching, usually no visible movement |
| Ad relevance | How closely your ad text matches the intent behind the search | Rewriting ad groups around tighter themes, matching headlines to what people actually type | A few days per ad group, doable in-house |
| Landing page experience | How relevant and useful your landing page is to people who click | Changes on the website — content, navigation, mobile layout | Weeks to months; this is web work, not an ad-account setting |
Expected CTR: Almost Nobody Controls This One
Expected CTR is scored against other advertisers bidding on the exact same search, not against your own history and not against a fixed benchmark. That framing matters: you can’t rewrite what a competitor’s ad says, and you can’t change how often people click ads for a search term in general. It’s also a measurement Google keeps deliberately separate from position and format — the score isn’t rewarded just for sitting higher on the page or carrying more assets.
This is also the piece of the puzzle where hiring anyone buys you the least — nobody outside the auction can rewrite what other advertisers do for the same search term. Where our own Google Ads management work spends time is on the two components below, the ones an account manager can genuinely move, not this one.
Ad Relevance: This One Is Actually Yours
Ad relevance measures “how closely your ad matches the intent behind a user’s search,” and it’s the closest thing to a real lever most advertisers have inside their own account. It’s unglamorous work: read the search terms report, read the ad groups sitting under it, and close the gap between the words people typed and the words your headlines use. Consolidating loose, single-keyword ad groups into tighter themes usually does more for this component than any headline tweak on its own.
The assets riding alongside that same ad — sitelinks, callouts, structured snippets — get pulled into the same auction calculation, and most accounts are quietly leaving some of them switched off, duplicated, or pointed at pages that don’t exist anymore.
Which of them are actually showing, and why, is its own subject: why your sitelinks don’t show.
Landing Page Experience: Fixed on the Website, Not in the Ads Account
Landing page experience measures “how relevant and useful your landing page is to people who click your ad” — and it’s the one component you fix entirely outside Google Ads. No bid adjustment touches it. No ad copy edit touches it. No account setting touches it.
This is also the only component where the lever sits on your website: page content, mobile layout, how easy it is to get somewhere else on the site once a visitor actually lands there — and, related but distinct, how page speed feeds into that same rating.
That side of it is covered in what the landing page experience score is really looking at.
Why Your Quality Score Column Is Often Just a Dash
Here’s the part almost nothing in the top results mentions. Quality Score is a historical number, built from how a keyword’s ads performed on the exact same search over the last 90 days. That word — exact — is doing a lot of work. Most accounts running Smart Bidding today lean heavily on broad match, not tightly built exact-match keyword lists, and Google has spent the past few years pushing campaigns further in that direction, not away from it. When the underlying exact-match search history is thin, there isn’t enough historical data to compute a score, and the column shows a dash instead of a number.
That has a direct knock-on effect for how accounts are structured, too — the old habit of splitting keywords into narrow, single-keyword ad groups to “protect” a high Quality Score runs into the same historical-data problem from the other direction.
That is the whole argument of what a modern account structure looks like.
In the accounts we manage, the Quality Score column on broad-match keywords is empty or nearly empty far more often than it isn’t. When an owner asks us to “raise the quality score,” what they’re usually asking for is a bigger number in a column that, for their account, doesn’t currently have one to raise. That’s not a flaw in the metric — it’s what happens when a scoring system built around exact-match keyword lists meets an account that’s been running broad match and consolidated ad groups for years.
If the diagnostic itself isn’t available, the closest substitute is the search terms report you already have. Open it for any campaign running broad match, and read the actual phrases people typed against the ad group they triggered. That comparison — the real words on one side, your headlines and keywords on the other — is roughly what ad relevance and expected CTR are trying to measure in the first place, just without Google publishing a number for it. Where the two lists diverge, that’s the maintenance work: tightening the ad group, adding a negative keyword, or moving a phrase into a group where it actually belongs. It won’t produce a score, but it fixes the thing the score would have been describing.

See It Yourself in Two Minutes
Open any campaign’s keyword view, click the columns icon, and turn on four: Quality Score, Exp. CTR, Ad Relevance, and Landing Page Exp. Then count. On accounts running broad match at any real volume, it’s common to see a dash next to most keywords instead of a number. That one screen tells you more about whether this metric even applies to your account than any percentage someone quotes you on a call.
The Number You Were Probably Quoted Is From 2013
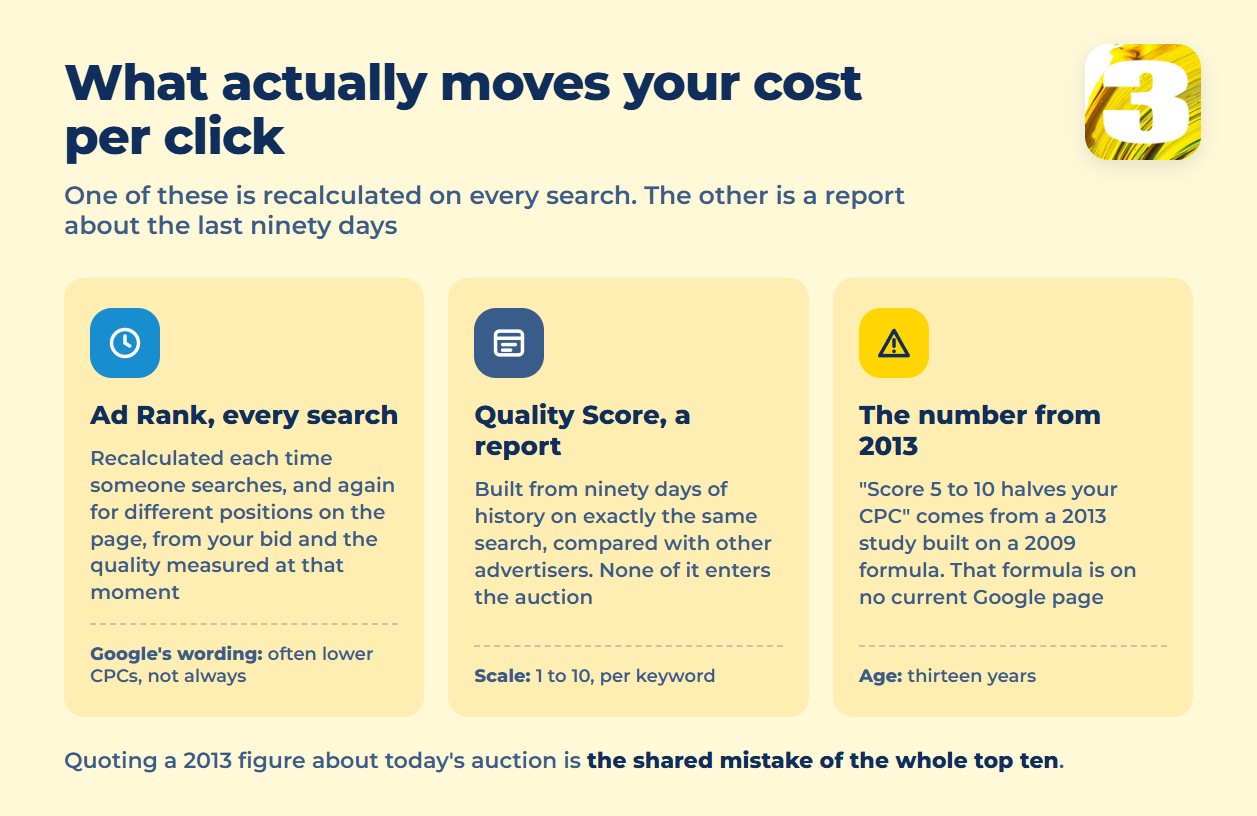
The specific claim that usually gets repeated — going from Quality Score 5 to Quality Score 10 cuts your cost per click roughly in half — traces back to an industry study published in 2013, built on an auction formula Google was using around 2009: actual CPC calculated as the ad rank of the advertiser below you, divided by your own Quality Score, plus one cent. That formula doesn’t appear on any current Google support page. Google has changed how the auction computes cost per click more than once since then, and none of the current documentation republishes that math or any percentage tied to it. Repeating a number that old as though it describes today’s auction is close to the entire top of the search results’ shared mistake on this topic.
Quality Score Is Not Ad Strength
The two get confused constantly because they’re both scores sitting near your ads in the interface. Ad Strength is a label Google shows while you’re building a responsive search ad — it grades whether you’ve given the system enough distinct headlines and descriptions to test combinations, on a scale from Poor to Excellent. It’s a creative-assembly checklist for one ad, generated before that ad ever runs.
Quality Score is a per-keyword diagnostic built from 90 days of auction history after ads have run. One is prospective and lives at the ad level; the other is retrospective and lives at the keyword level. An Excellent Ad Strength label says nothing about your Quality Score, and a low Quality Score isn’t fixed by adding more headline variations.
The confusion gets expensive because the two run on different clocks. Ad Strength is graded before the ad has served a single impression — it’s checking whether you gave the system enough raw material to test headline and description combinations against each other. Quality Score is graded after 90 days of that ad actually running against real searches. Someone who adds headlines until Ad Strength reads Excellent has done a real, useful thing for how the ad gets assembled — but they haven’t touched the keyword-level history Quality Score is built from, and they shouldn’t expect next month’s cost per click to move because of it. Waiting for an Excellent label to translate into a lower CPC is waiting for one metric to affect a different metric it was never connected to.
What Actually Moves Your Cost Per Click
The number that does enter the auction is Ad Rank, and it’s recalculated on every single search, not stored from 90 days ago. Google is specific about this on its Ad Rank support page: “Ad Rank is calculated every time a user does a search and is recalculated for different positions on the search results page,” and the calculation “incorporate[s] your bid and auction-time quality that can include auction-time measurements like expected CTR, ad relevance, and landing page experience.” That auction-time quality is a fresh calculation, not the stored 1–10 figure you see in your account — Google draws this distinction on its own ad quality guidance: the score in your account is a historical report, while the auction itself runs on quality measured at the moment the ad actually shows. Google’s own framing of the payoff is careful, not absolute: “Higher quality ads can often lead to lower CPCs” — often, not automatically, and not by a published percentage. If what drives your cost per click more broadly is the part you’re trying to untangle, we’ve written separately about Google Ads cost. If the auction mechanics themselves are still fuzzy, our overview of how Google Ads works walks through Ad Rank and its inputs.
None of this is something you verify by staring at the account for a day. If you rewrite ad relevance this week, telling that apart from ordinary auction noise takes a controlled comparison, not a gut read on next Tuesday’s average CPC.
Running that comparison properly is covered in what to test before the AI Max migration.
What to Do This Week, in Order
Skip the seven-point checklist. In practice, this comes down to three steps, taken in order.
First, check whether you even have the number. Turn on the four columns from the section above and see how many keywords carry a real score versus a dash. If most of your volume runs broad match, you may be optimizing toward a diagnostic that barely exists for your account.
Second, work on ad relevance. It’s the one component that’s genuinely yours, it takes days rather than months, and it doesn’t require touching the website. Pull the search terms report, compare it against your ad groups, and close the gaps.
Third, put landing page experience in the queue as a website project, not as a task inside Google Ads. Nothing you click in the ads interface fixes it, and treating it like an account setting just delays the actual fix.
The Short Version
Ad relevance is genuinely yours to rewrite this week. Landing page experience is a website project, not an ads-account setting. Expected CTR mostly isn’t yours to move at all, and the 1–10 number you’ve been told to chase may not exist for half your keywords anyway, because it was never built for an account running broad match. None of that means the auction ignores quality — it means the number displayed in your account isn’t the thing the auction is actually scoring in real time.
If you want a second set of eyes on what your account and your landing pages are actually doing at auction time — not on pushing a diagnostic number that may not even be populated — that’s what our Google Ads audit looks at first.